January 2025 — May 2025
Live versionChallenge
Developing a page with dynamic data and a custom interactive Sankey diagram.
My Role
Frontend development
Introduction
After the successful Handelsblatt AI Trend Report project, the WongDoody team from the UK reached out for collaboration on a PwC project, since its structure was similar to what we had built before.
PwC is an international network of companies headquartered in the UK, providing professional services in auditing, taxation, and consulting. It is part of the so-called "Big Four" accounting firms, alongside Deloitte, EY, and KPMG.
Vision, Timeline, and Challenges
The client faced difficulties finalizing the design, which led to radical changes in the component structure. The main challenge was that deadlines remained fixed, while the workload kept growing.
Additionally, the client wanted a custom Sankey diagram. Unlike a regular Sankey diagram, the left and right parts had to differ in size — both in values and visually. The issue was that no library offered such functionality out of the box. The client insisted on this requirement, standing firm. We, of course, had to develop it because "the client is always right."
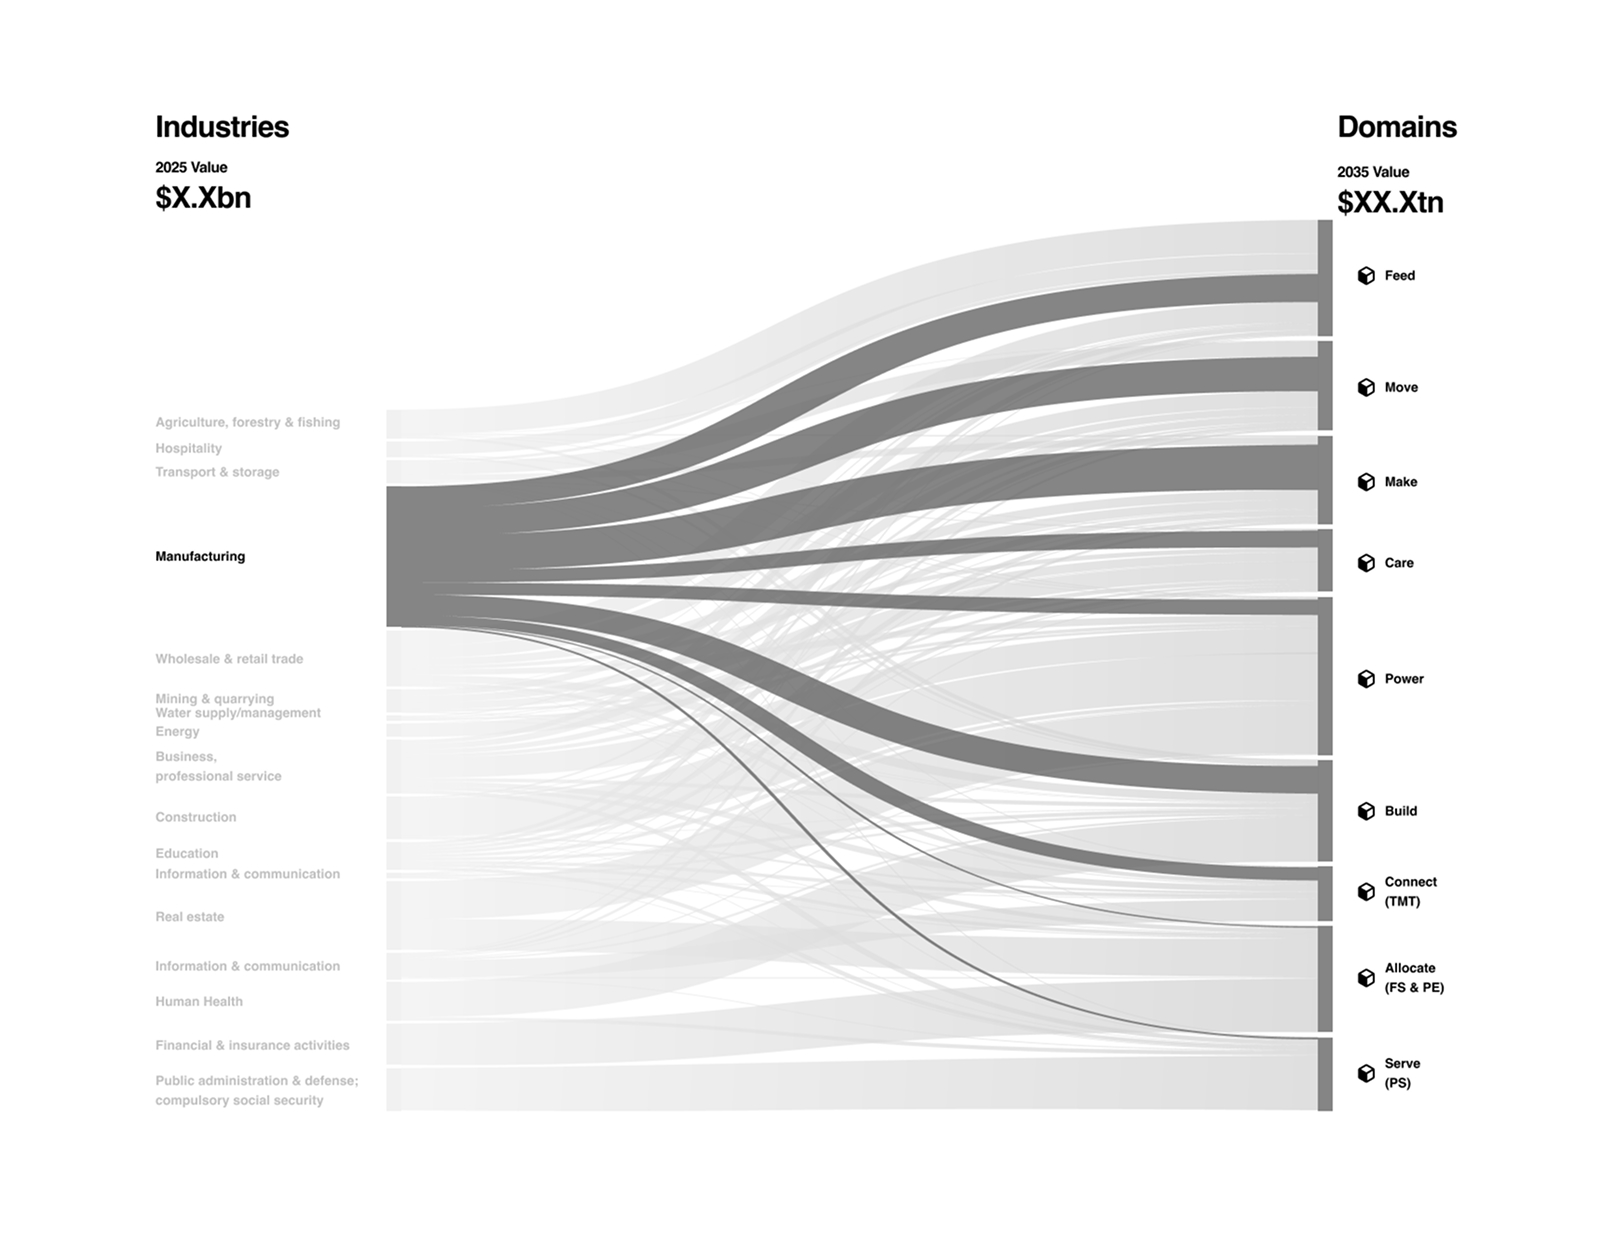
Diagram prototype
Sankey Diagram
At first, we researched all possible solutions available. When we found nothing suitable, we informed the client that what they wanted simply didn’t exist and would require custom code — and even then, it wasn’t guaranteed to succeed. Creating diagrams is no trivial task. Our whole team brainstormed, and finally I thought: "Why not try building a new diagram based on the functions provided by D3?"
D3 is a powerful library for charts and diagrams with wide customization options. Most importantly, it provides mathematical functions for drawing custom SVG shapes, coloring them, and manipulating them dynamically.
External developers were also brought in for this task. Still, it was crucial for us to solve it ourselves, as our team’s reputation was at stake. In the end, I succeeded.
Breaking Down the Structure
Essentially, a Sankey diagram consists of two elements: nodes and links. A node is simply a rectangle representing an object, from and to which a link goes. A link is a curved line connecting different objects. Each link consists of four points, and its curvature is defined by a Bézier curve.
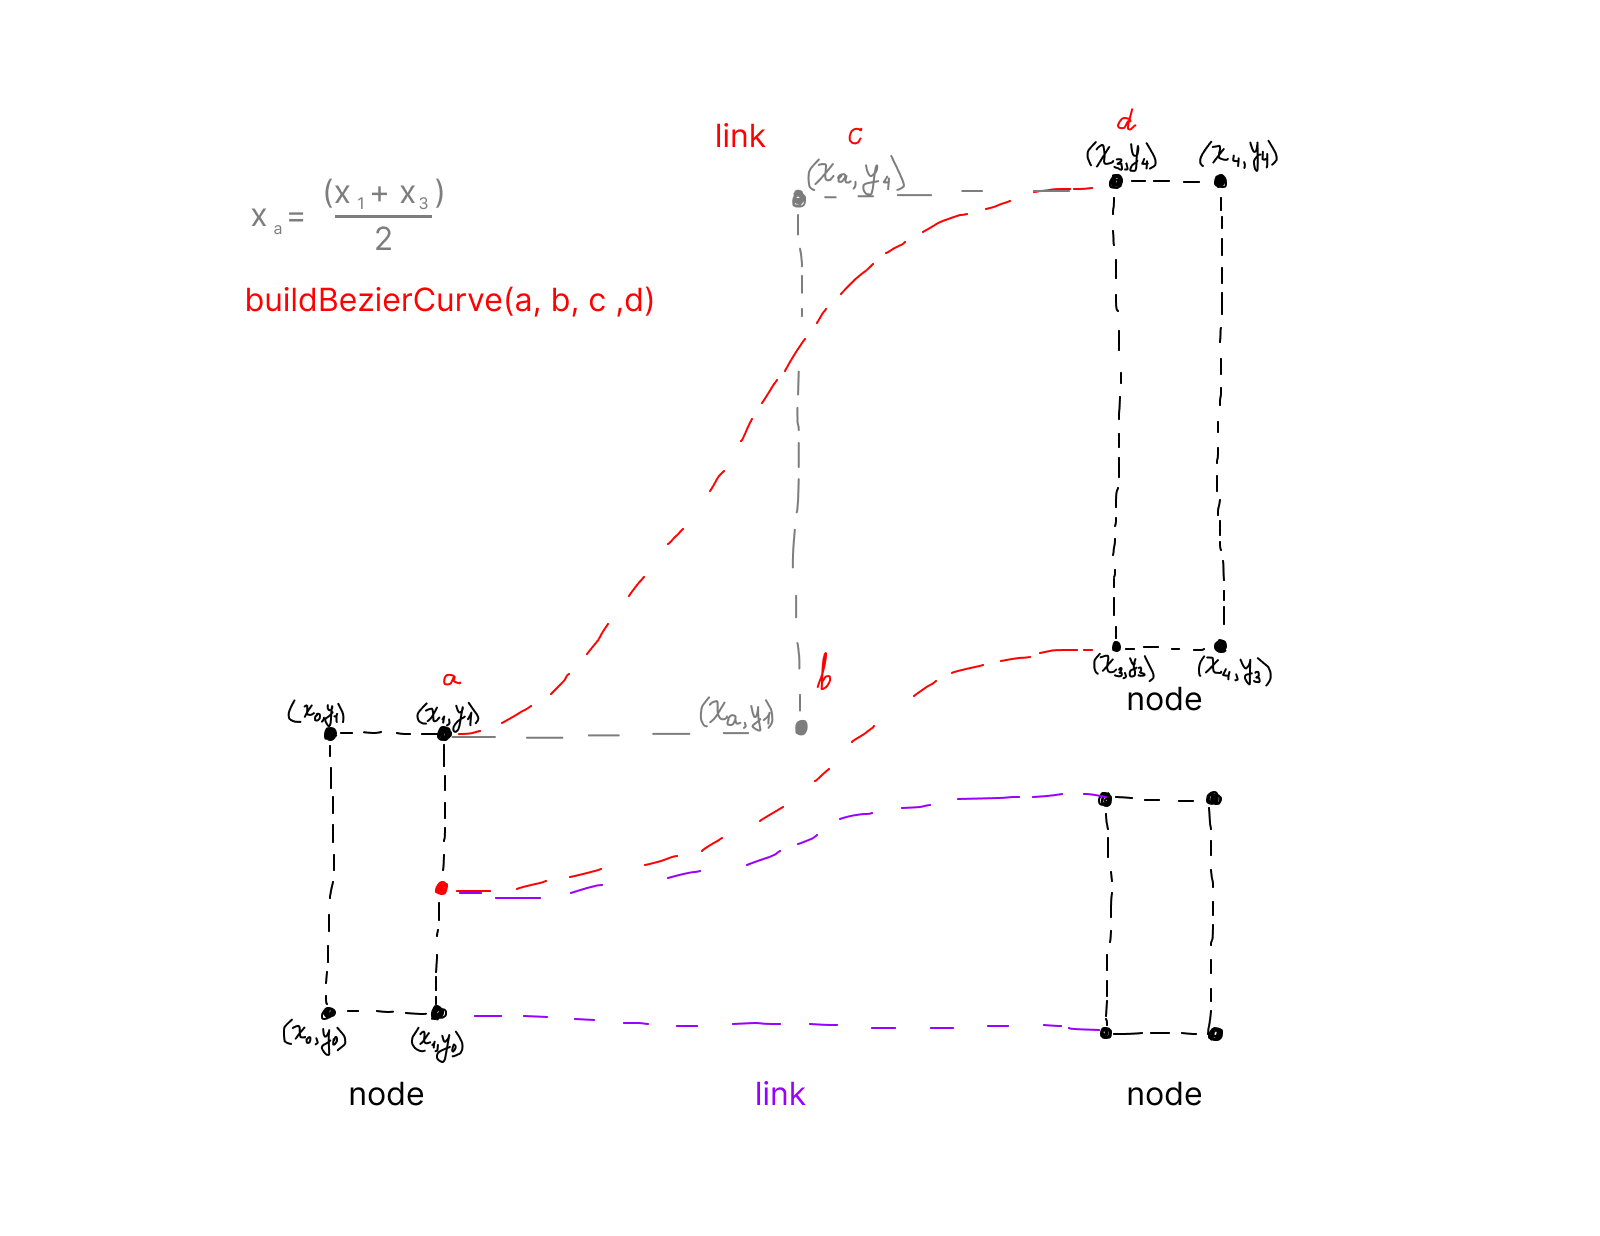
Diagram structure
The elements are simple in theory, but writing a dynamic algorithm to keep everything connected was no easy task. After several sleepless weeks of trials and experiments, I finally succeeded! The result was a beautiful diagram that smoothly transitioned between values.
The diagram was built exactly as the client wanted, our reputation reinforced, though plenty of revisions and further work still lay ahead.
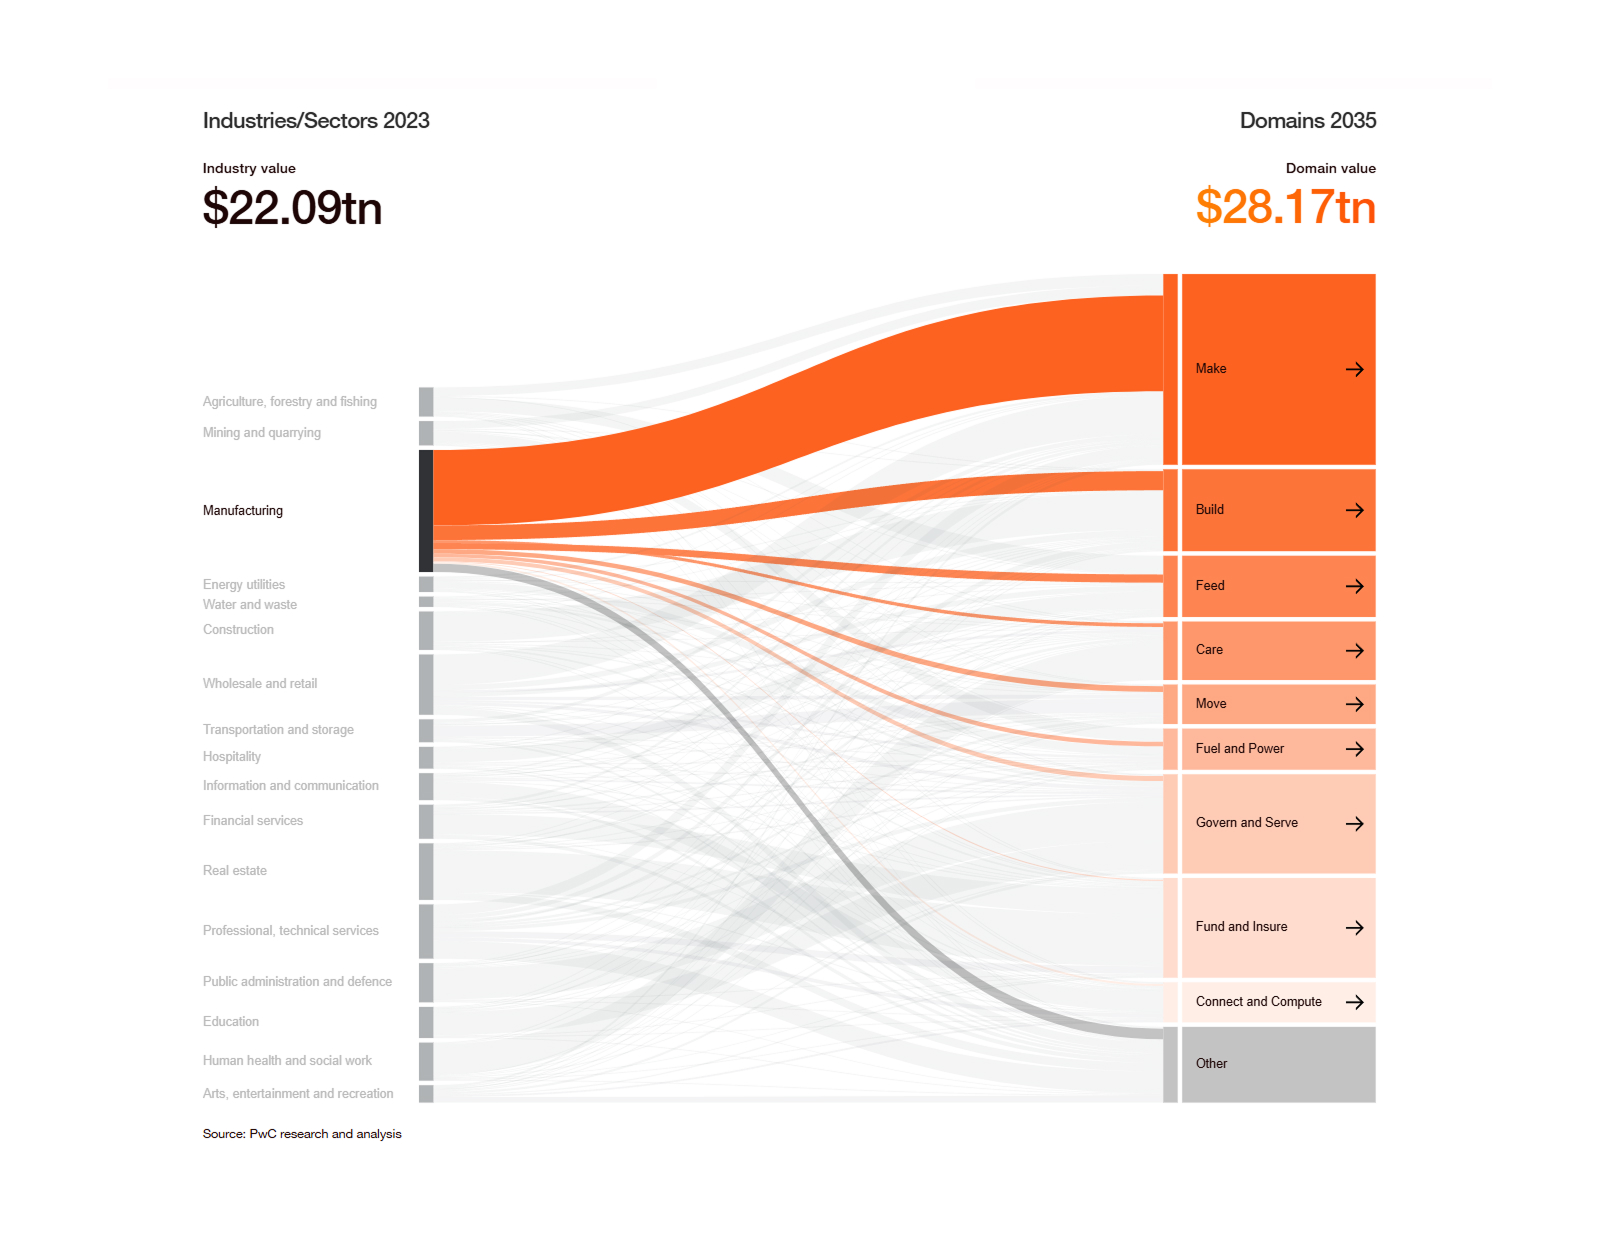
Final result
Architecture & Systematic Approach
We decided to build the project using React with TypeScript and Tailwind. As the bundler, we chose NX. Once we received the design system, I took the initiative to develop utility classes to simplify styling and ensure the codebase had a clear, intuitive structure.
Tailwind is perfect for structuring styles. Its flexibility to configure almost anything is a huge advantage: colors, typography, containers, spacing, and breakpoints. Everything was strictly organized with variables imported from Figma — meaning that coding from Figma was straightforward thanks to consistent naming and predictable component behavior.
From there, it was simply about creating components, sections, and connecting them into one page.
Final Page

Conclusion
I gained valuable experience in developing custom diagrams with D3, deepened my understanding of frontend architecture and its synchronization with a design system in Figma, and strengthened my expertise in delivering large-scale projects.