February — November 2024
Live versionChallenge
Developing a page with dynamic data, charts, animations, and a smart chat capable of reflecting results directly on the page.
My Role
Frontend development
Introduction
After WongDoody acquired Oddity, we received a new prestige project. For our team, it was important to create something outstanding to build reputation. Looking ahead, I can say that despite numerous challenges along the way, we won a bronze award at the Deutscher Digital Award.
Handelsblatt is a German-language business newspaper published in Düsseldorf. It is one of the largest and most influential business newspapers in Germany, covering economic and financial topics.
Goal & Structure
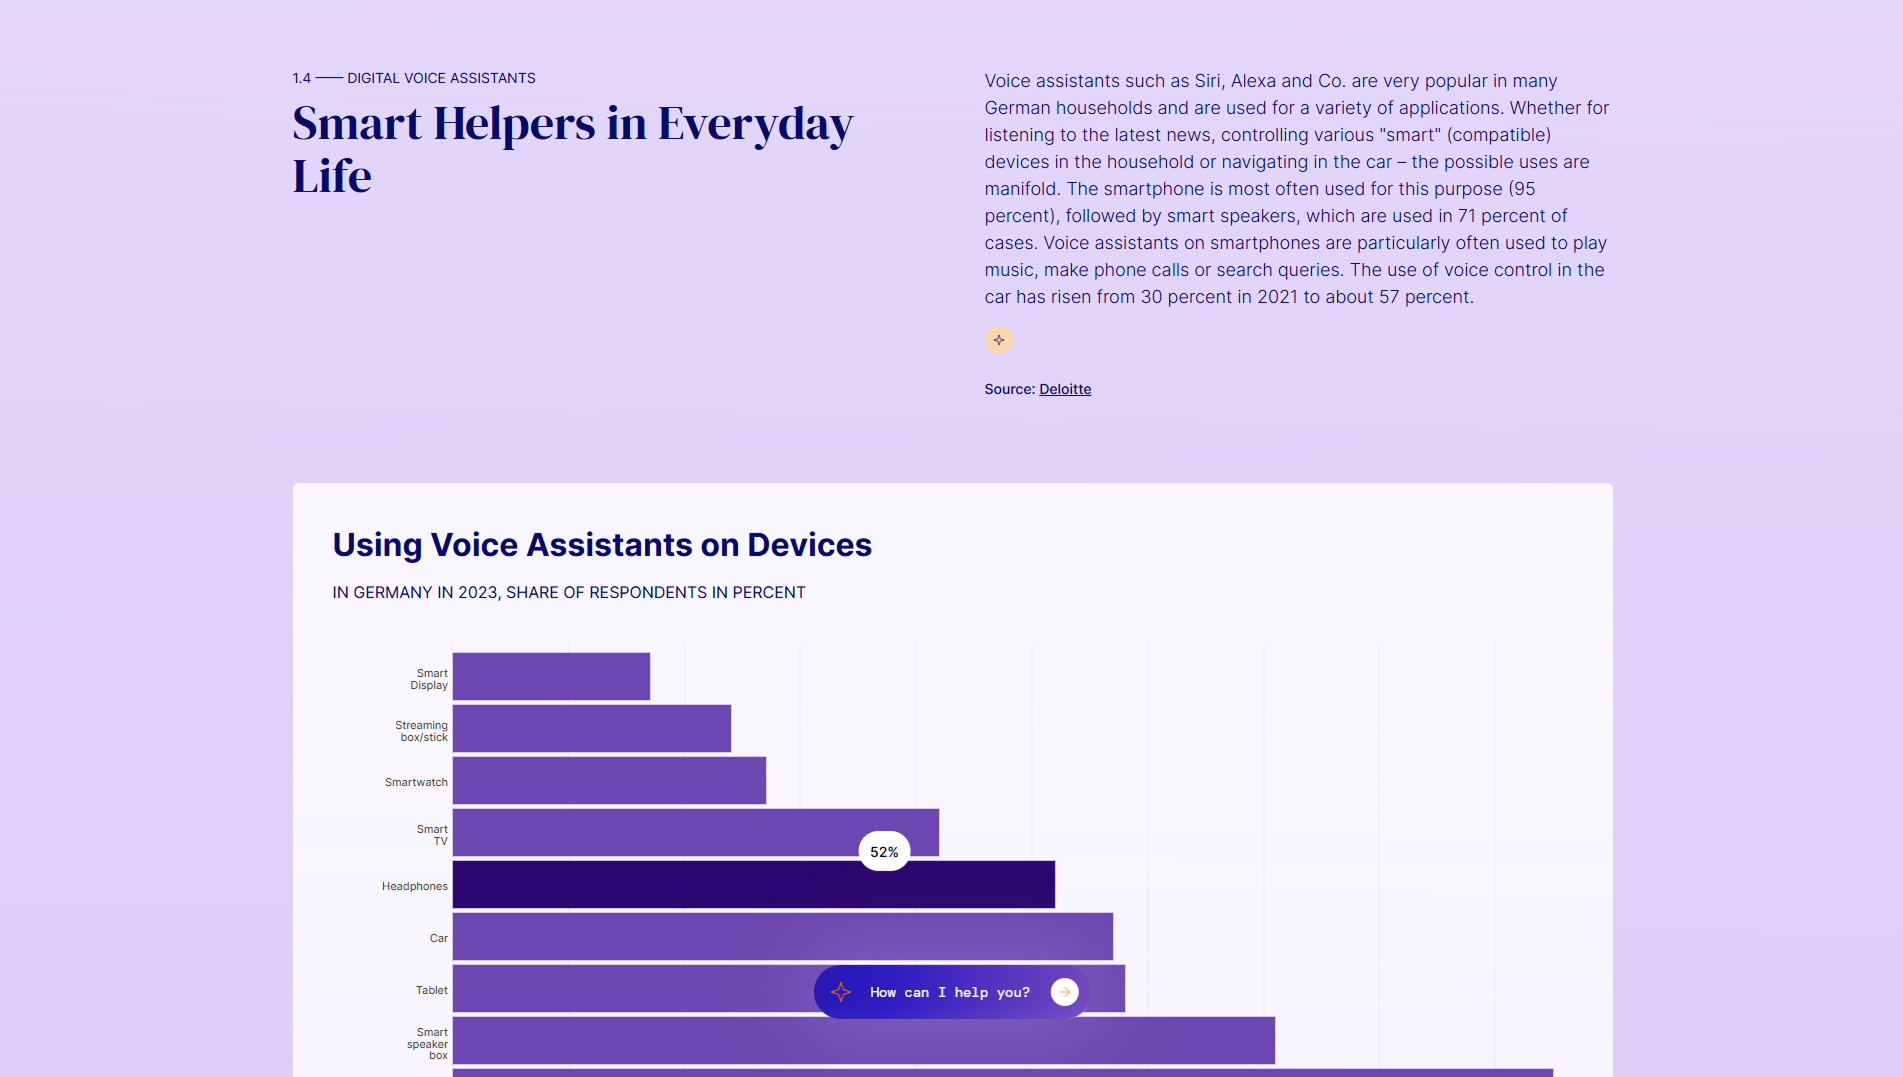
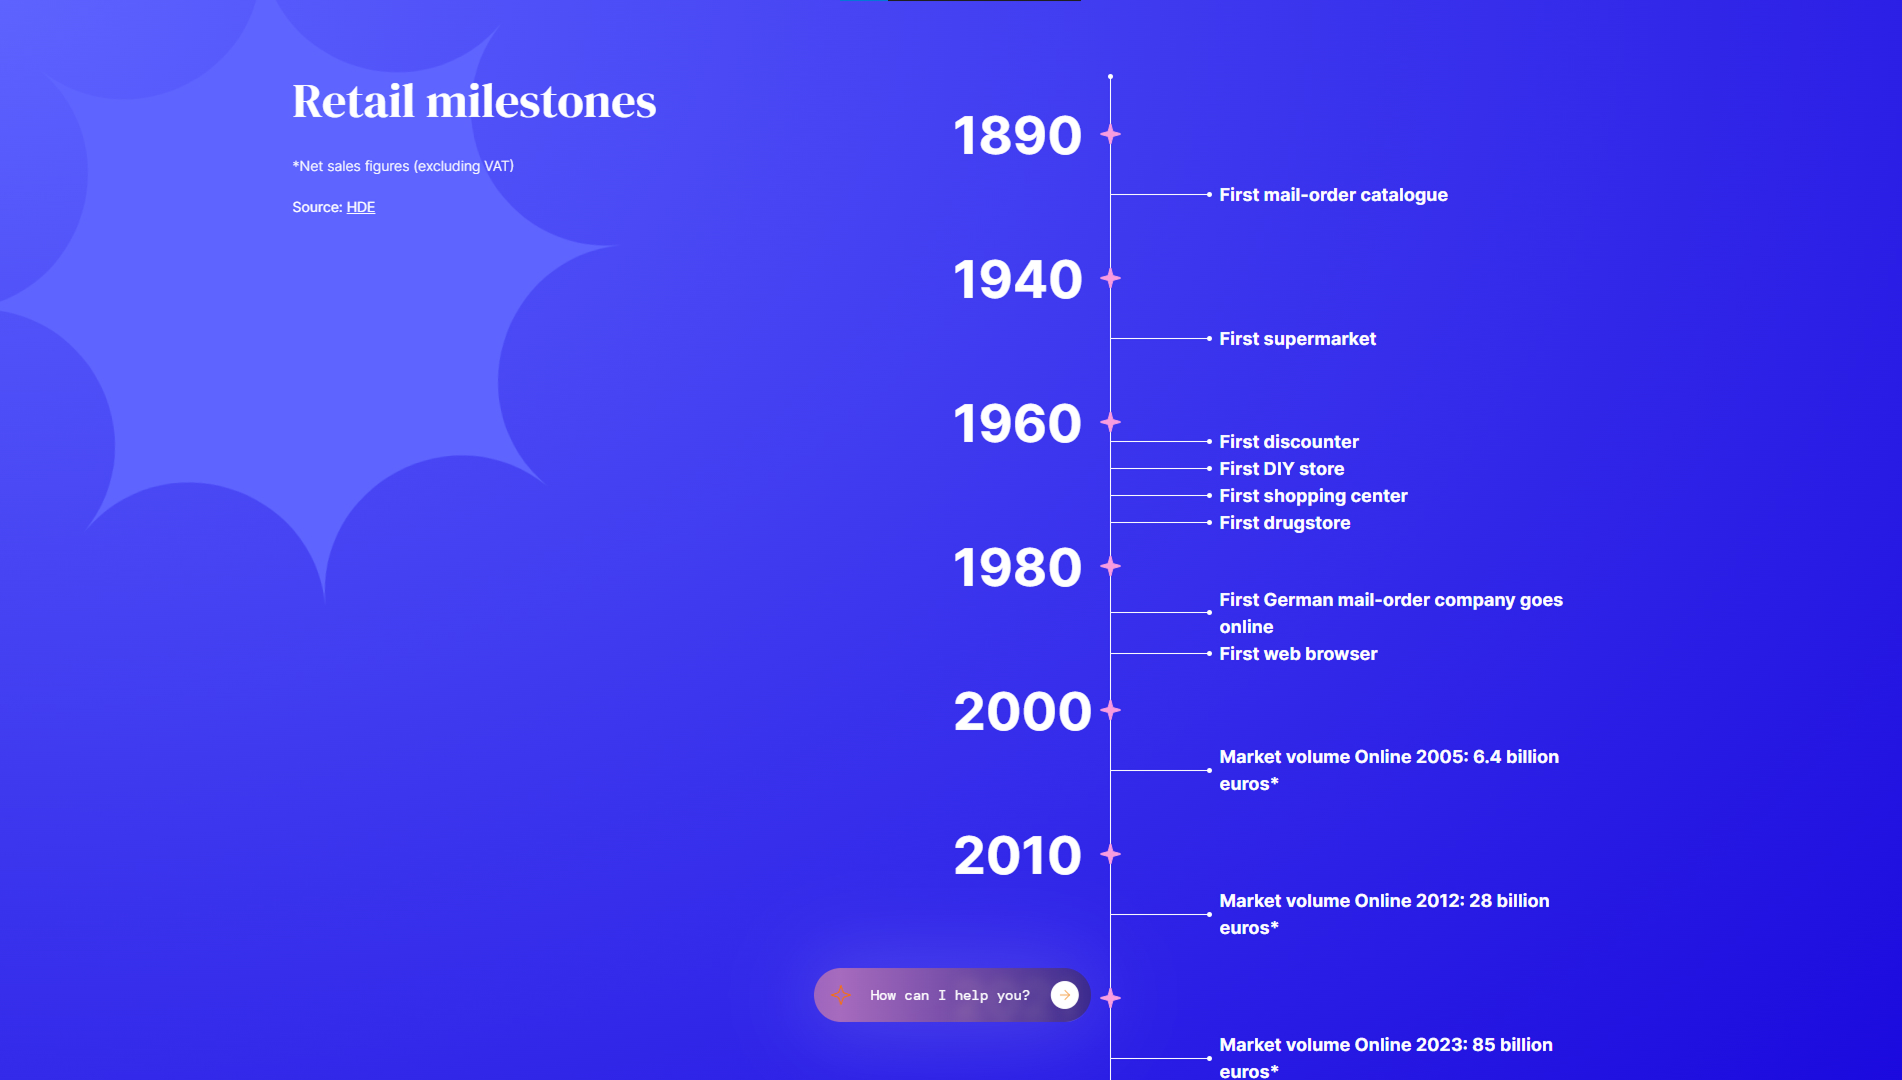
The project aimed to demonstrate the impact of artificial intelligence on various sectors of the economy. This was achieved through charts and statistics provided by the client. These datasets were divided into sections, each representing a specific industry. The data was dynamic and fully available for AI-driven analysis, with which users could interact via an integrated chat.
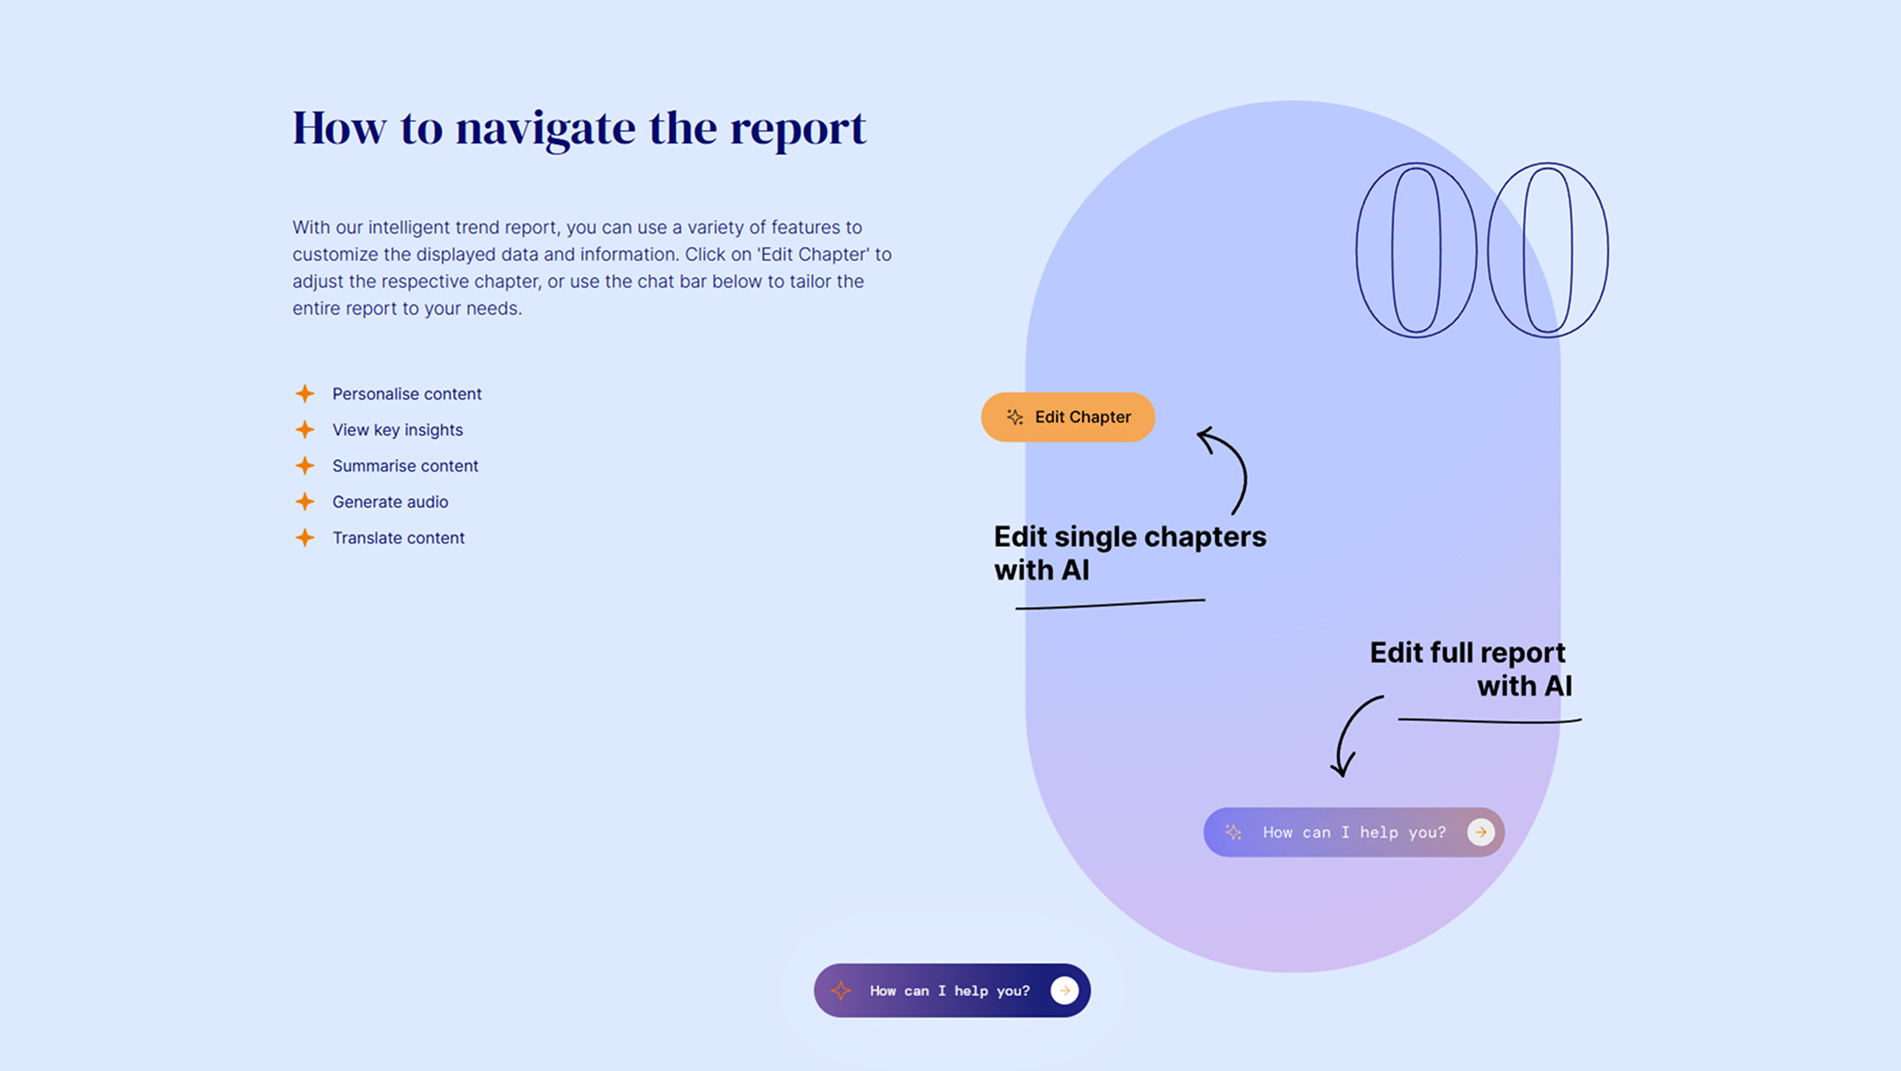
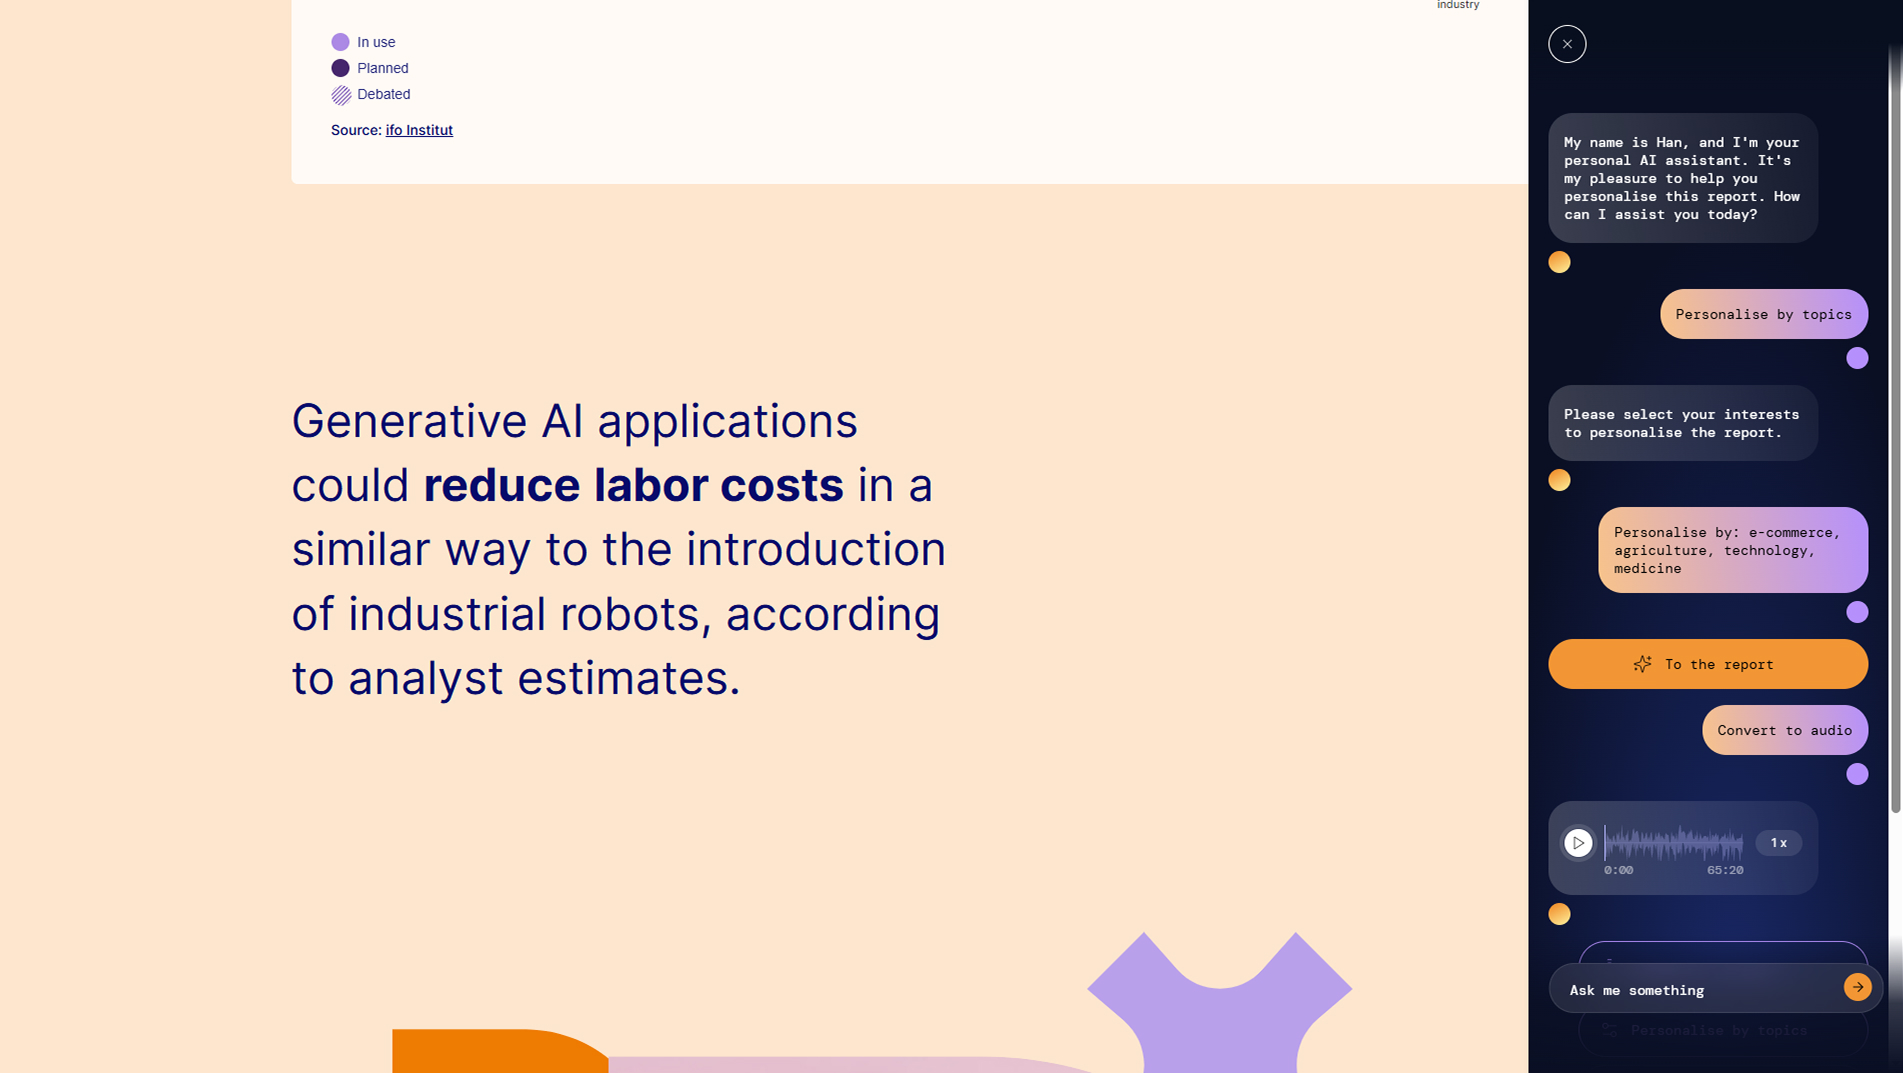
Beyond regular AI responses in the chat, functionality included shortening or expanding text on the page, personalizing the content based on user interests, generating text summaries, and converting information into audio format.
Architecture
The data was initially delivered in Excel format, for which we wrote a script to convert it into JSON. Data types for the components were carefully designed, so the generated JSON file was translated into a structured object and then imported section by section, where an algorithm determined which component to render depending on the data type.
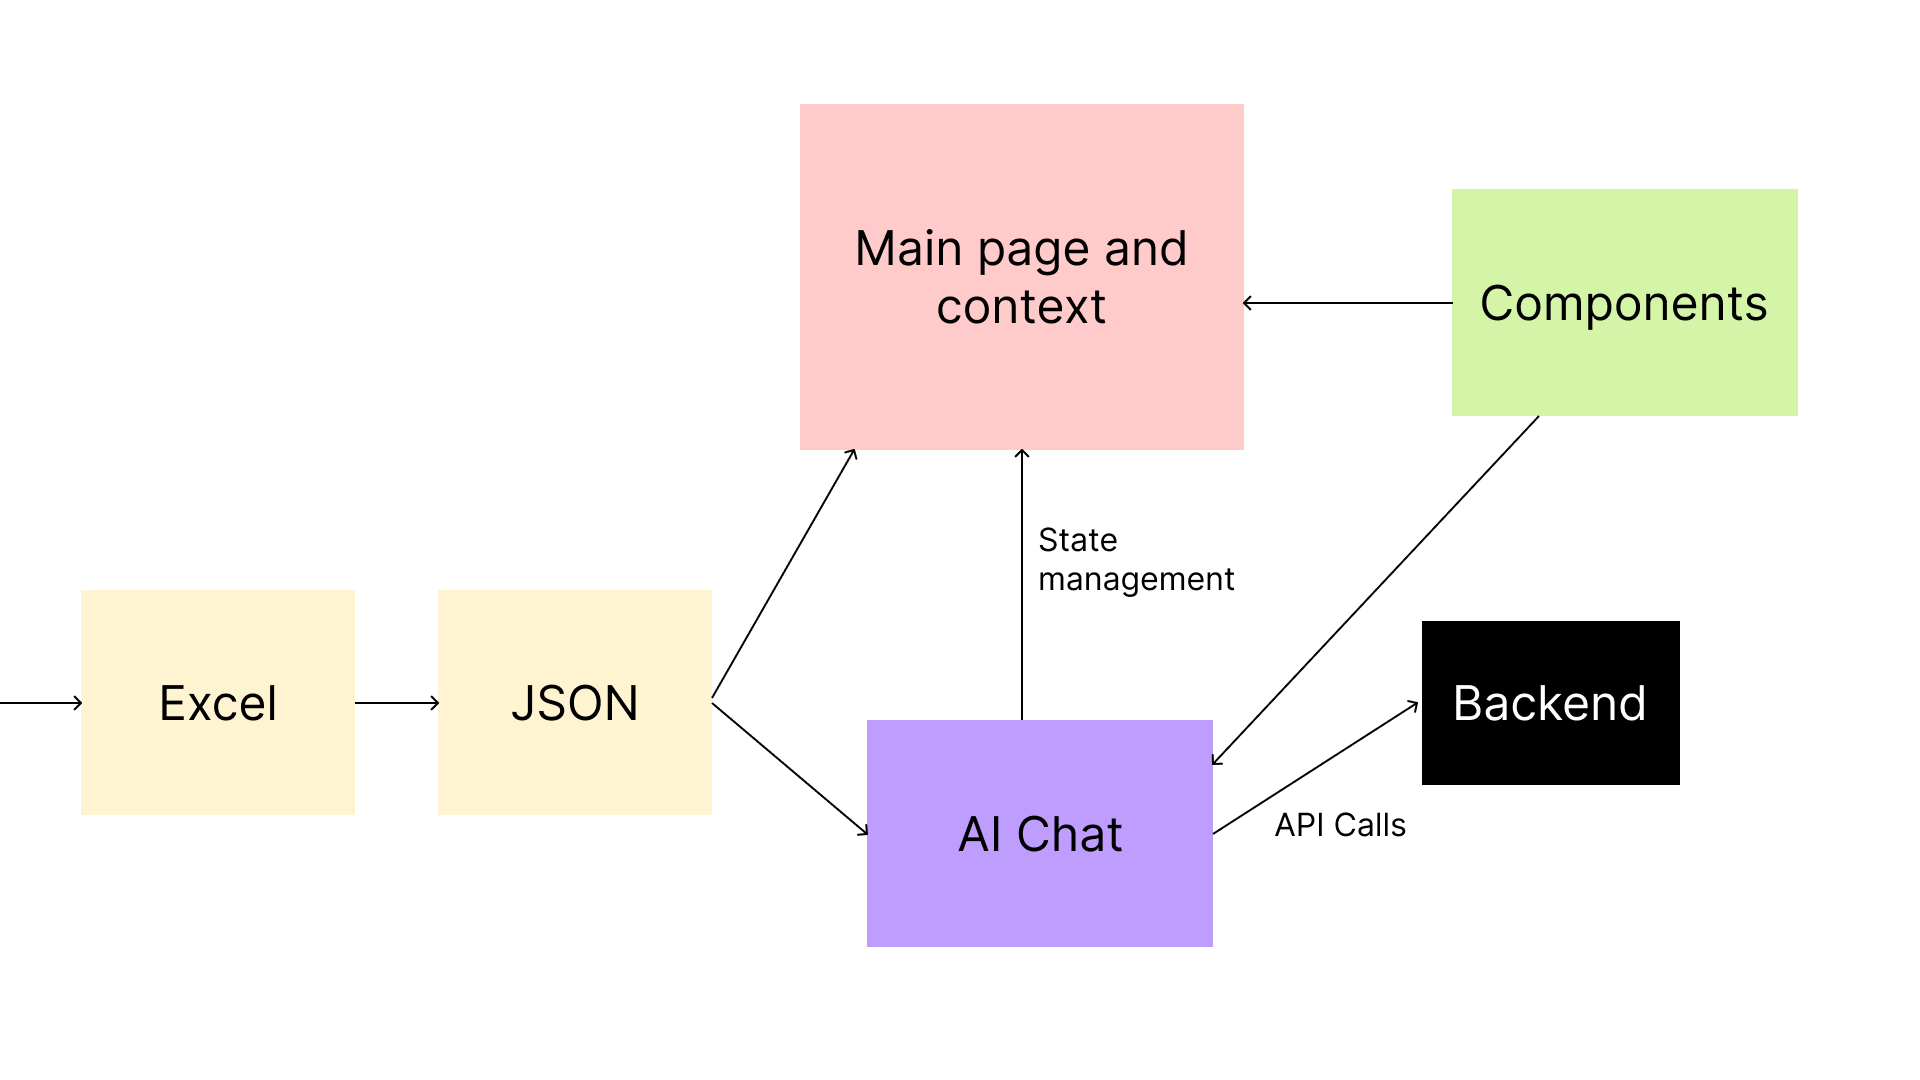
Project architecture
This architecture gave the client control over the content structure while freeing us from manual work in the future. It was also essential for proper chat functionality, especially if structural changes were required.
Tech Stack
We used React with TypeScript as the main framework, along with Tailwind for a granular approach to styling components and sections. This turned out to be a wise choice, as it saved us significant time during numerous revisions. For the bundler, we selected Astro. After experimenting with several libraries, we finally chose Nivo Charts for its simplicity of integration and clean design. The chat backend was provided by another team from Infosys.
Project Vision Challenges
Initially, the project was meant to focus on a visual storytelling experience of data interpretation through animations and interactive charts — scrollytelling. But problems arose early in development, as the design kept changing weekly and parts of the code quickly became outdated or unnecessary. Such a volume of changes, of course, took a toll on team morale. Eventually, an interactive chat feature was added, although it had not been part of the original plan.
Solutions
Management made smart decisions to limit the scope of client edits, encourage closer collaboration between designers and developers to align technical capabilities with design requirements, and reduce the feedback cycle.
My Contribution
As a team member, I contributed by developing components, sections, and modules — chat, navigation, feedback form — as well as integrating and synchronizing contexts, optimizing animations, and handling countless revisions.
In my opinion, there weren’t particularly complex technical challenges in the project; the main difficulties were the project vision and communication with the client.
Results
Conclusion
I gained experience working with chart libraries, advanced my skills with Tailwind, strengthened my knowledge in React, and developed valuable expertise in team communication and project vision — both organizational and technical. I am satisfied with the outcome and proud of our shared award despite all the challenges.